Taxonomic classification with sourmash
A sourmash tutorial
Objectives
- Classify your reads into taxa
- Compare taxonomic classification from multiple datasets
At the beginning
mkdir sourmash_gather
cd sourmash_gather
curl -O https://s3-us-west-1.amazonaws.com/spacegraphcats.ucdavis.edu/microbe-genbank-sbt-k51-2017.05.09.tar.gz
tar xzf microbe-genbank-sbt-k51-2017.05.09.tar.gz
Installing sourmash
To install sourmash, run:
sudo apt-get -y update && \
sudo apt-get install -y python3.5-dev python3.5-venv make \
      libc6-dev g++ zlib1g-dev
this installs Python 3.5.
Now, create a local software install and populate it with Jupyter and other dependencies:
python3.5 -m venv ~/py3
. ~/py3/bin/activate
pip install -U pip
pip install -U Cython
pip install -U jupyter jupyter_client ipython pandas matplotlib scipy scikit-learn khmer

pip install -U https://github.com/dib-lab/sourmash/archive/master.zip
Generate a signature for Illumina reads
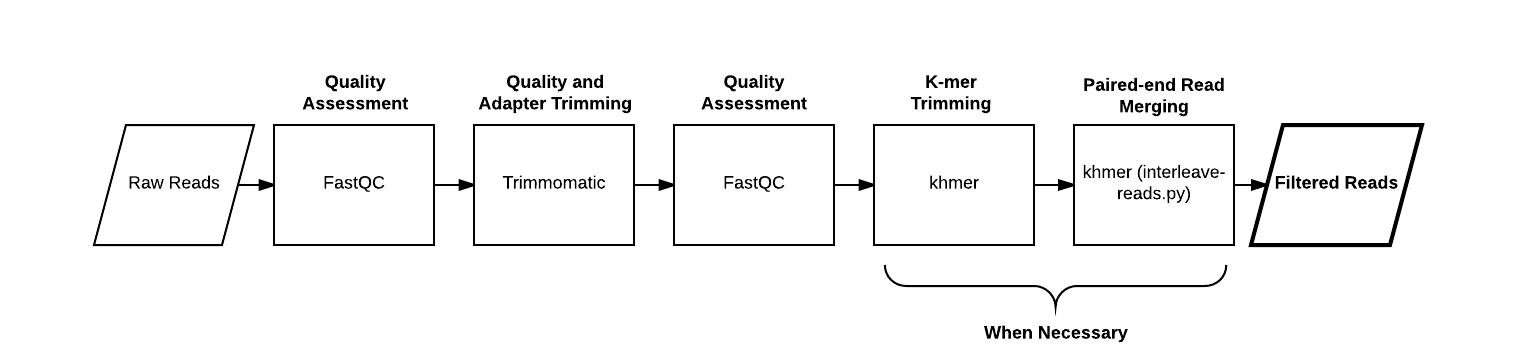

Calculate signatures
pip install osfclient
osf -p ay94c fetch osfstorage/reads/SRR1976948.abundtrim.subset.pe.fq.gz
sourmash compute -k51 --scaled 10000 ../work/SRR1976948.abundtrim.subset.pe.fq.gz -o SRR1976948.scaled10k.k51.sig
Taxonomic classification
sourmash gather -k51 SRR1976948.scaled10k.k51.sig genbank-k51.sbt.json --csv SRR1976948.scaled10k.k51.csv
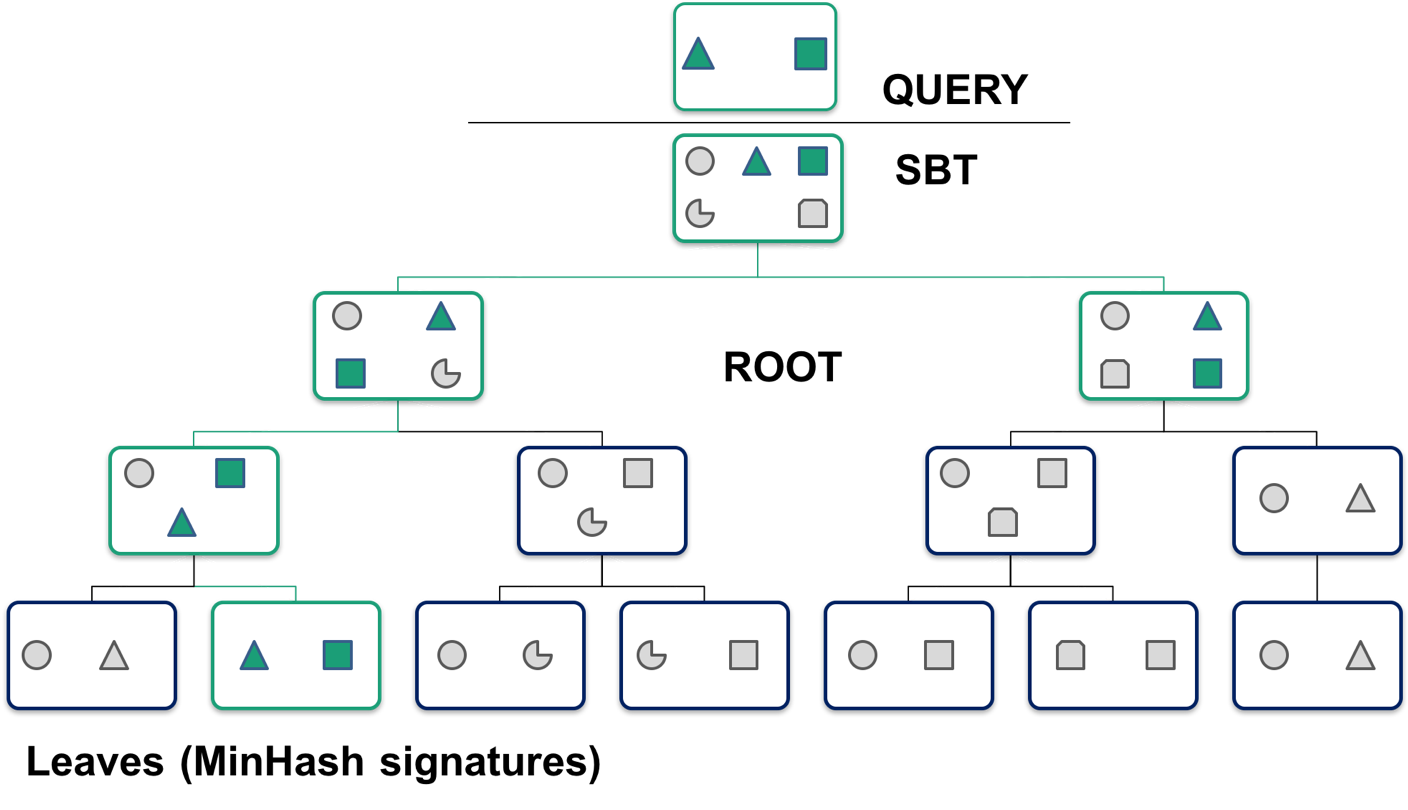
What does the database look like and how does gather work?
You should see output like this
loaded query: ../work/SRR1976948.abundtrim.s... (k=51, DNA)
loaded 0 signatures and 1 databases total.
overlap     p_query p_match
---------   ------- --------
1.9 Mbp       9.0%   99.0%      LGGB01000030.1 Synergistales bacteriu...
1.5 Mbp       7.1%  100.0%      LGGN01000313.1 Proteiniphilum acetati...
1.5 Mbp       7.0%   99.3%      LGGR01000252.1 Petrotoga mobilis isol...
1.4 Mbp       6.4%   99.3%      LGGV01000121.1 Synergistales bacteriu...
0.7 Mbp       3.1%   98.5%      LGGS01000125.1 Pelotomaculum thermopr...
0.6 Mbp       2.9%  100.0%      LGFW01000077.1 Parcubacteria bacteriu...
0.6 Mbp       2.7%   98.3%      LGGG01000064.1 Parcubacteria bacteriu...
1.1 Mbp       5.0%   44.6%      LGHH01000265.1 Proteiniphilum sp. 51_...
0.5 Mbp       2.5%   24.1%      LGGZ01000271.1 Thermotogales bacteriu...
1.4 Mbp       6.8%   23.8%      LGHG01000227.1 Synergistales bacteriu...
0.5 Mbp       2.4%   57.7%      LGHC01000091.1 Parcubacteria bacteriu...
110.0 kbp     0.5%    7.4%      LGFQ01000086.1 Synergistales bacteriu...
230.0 kbp     1.1%    6.2%      LGFC01000097.1 Petrotoga mobilis isol...
100.0 kbp     0.5%    8.9%      LGFS01000020.1 Thermovirga lienii iso...
1.3 Mbp       5.9%    7.1%      LGGE01000110.1 Synergistales bacteriu...
70.0 kbp      0.3%   87.5%      LGHI01000016.1 Thermoplasmatales arch...
found less than 10.0 kbp in common. => exiting

found 16 matches total;
the recovered matches hit 48.4% of the query
Download signatures for comparison
osf -p ay94c fetch osfstorage/gather_csvs/SRR1977249.reads.scaled10k.k51_gather_output.csv
osf -p ay94c fetch osfstorage/gather_csvs/SRR1977296.reads.scaled10k.k51_gather_output.csv
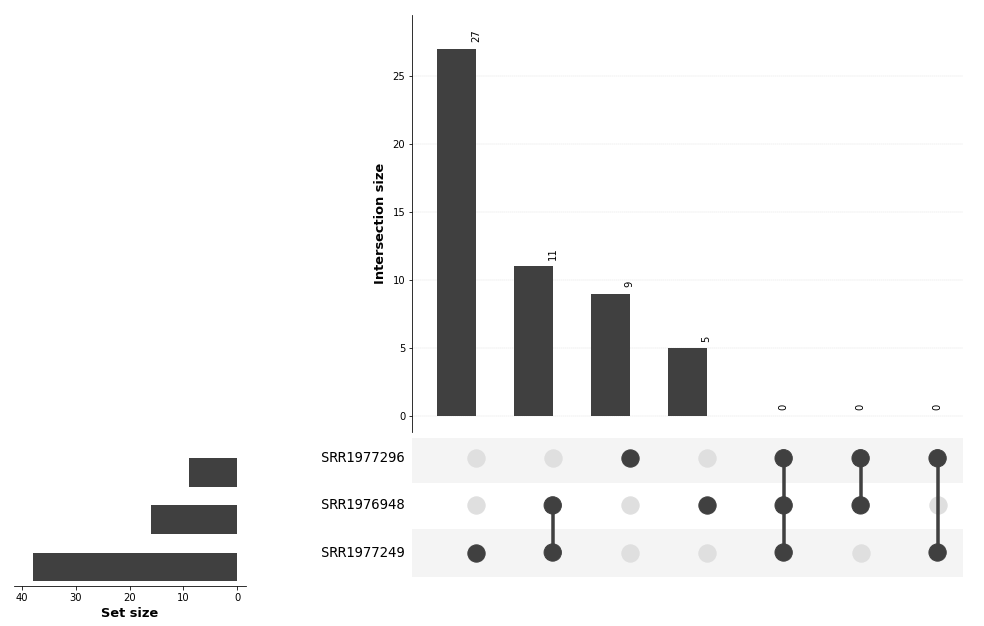
Plot interactions with pyupset
First, open jupyter notebook and then:
#Install pyupset to generate a visual representation of the "interactions" between datasets
!pip install pyupset
#Import pyupset and dependencies
import pyupset as pyu
import matplotlib as mpl
import matplotlib.pyplot as plt
from pickle import load
import pandas as pd
%matplotlib inline
#Read in your data
df1=pd.read_csv('SRR1976948.scaled10k.k51.csv')
df2=pd.read_csv('SRR1977249.reads.scaled10k.k51_gather_output.csv')
df3=pd.read_csv('SRR1977296.reads.scaled10k.k51_gather_output.csv')
# Create a new dataframe with the column of interest and generate csv with the output

df1[['name']]
df2[['name']]
df3[['name']]
df1.to_csv('SRR1976948.scaled10k.k51.names.csv')
df2.to_csv('SRR1977249.reads.scaled10k.k51_gather_output.names.csv')
df3.to_csv('SRR1977296.reads.scaled10k.k51_gather_output.names.csv')
# Import glob and create a dictionary of dataframes with name 'metaG*csv' with ',' delimiter. Split the file names by
# '_' to generate unique file names for output.
import glob

genus_dict={}
for file in glob.glob('*names.csv'):
    df=pd.read_csv(file, delimiter = ",")
    x=file.split('.')[0]
    genus_dict[x]=df
pplot=pyu.plot(genus_dict, unique_keys = ['name'])
pplot['figure'].savefig('Hu_metaG_comparison.png')
LICENSE: This documentation and all textual/graphic site content is released under Creative Commons - 0 (CC0) -- fork @ github.